
Key points
▶ NASA’s Earth Observatory released side-by-side maps of Pacific sea-surface height from October 13, 1997, and October 12, 2026. Comparing 35 years of satellite records on the same orbital track, NASA says the current trend could take this year’s El Niño beyond the 1997 event.
▶ On October 8, NOAA put the odds of a strong El Niño continuing through January–March 2027 at 83%. The WMO forecast that sea-surface temperatures in the monitoring region would reach 3.7°C above average in October–December, a record high.
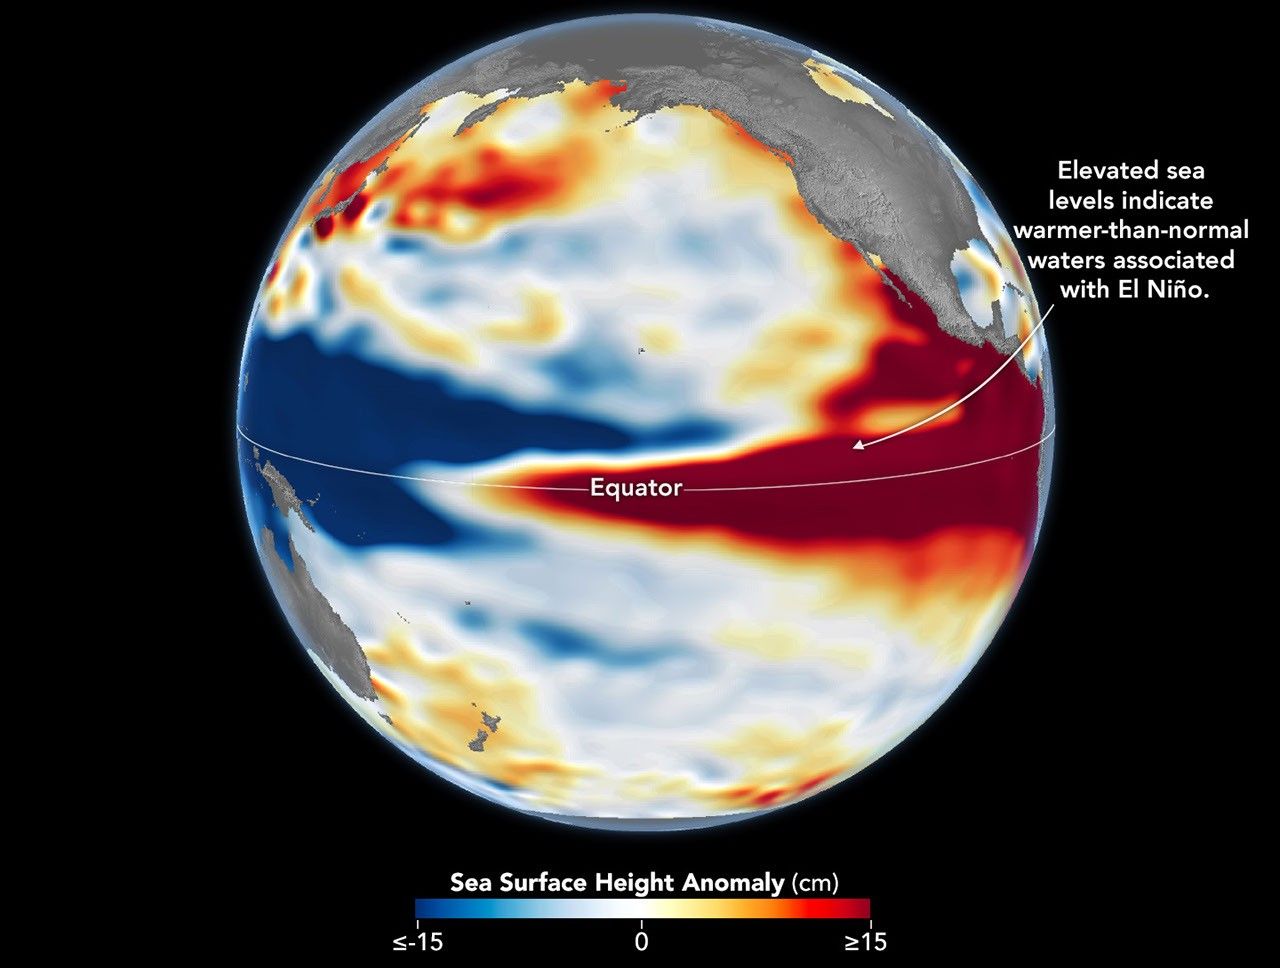
The ocean that disrupted global weather 29 years ago has returned. NASA’s Earth Observatory released side-by-side maps of Pacific sea-surface height from October 13, 1997, and October 12, 2026, saying this year’s El Niño is developing in a pattern similar to the “record-breaking” 1997–98 event.
Josh Willis, a sea-level researcher at NASA’s Jet Propulsion Laboratory (JPL), said that if the current trend continues, this year’s event could be larger than the one in 1997.
◆ Heat measured through sea-surface height
El Niño is a phenomenon in which waters in the eastern equatorial Pacific become warmer than average every two to seven years. Under normal conditions, trade winds push warm surface water toward the western Pacific, making sea levels there higher than in the east.
When the trade winds weaken, the warm water that has accumulated flows eastward. This can weaken the winds further or even reverse their direction, sending more warm water east. As this feedback loop intensifies, heat builds up in the central and eastern Pacific.
Satellites measure that heat through sea-surface height. Water expands as it warms. When sea levels in the central and eastern Pacific are higher than average, it indicates that heat has accumulated there.
NASA’s maps were created using data from the TOPEX/Poseidon satellite for 1997 and the Sentinel-6 Michael Freilich satellite for 2026. Seasonal variations and long-term trends were removed to show only short-term fluctuations such as El Niño. Areas higher than average are shown in red and lower-than-average areas in blue.
The two maps look similar. Both show lower sea levels in the western Pacific and higher levels in the eastern Pacific, with warm, elevated water reaching the coast of South America. Willis said the 2015–16 El Niño was also very strong, but the warm water did not extend as close to the South American coast, resulting in a different distribution of impacts. In 1997–98, California and the southern United States received heavy rainfall; in 2015–16, rain was concentrated in Central America and the southeastern United States, causing major flooding in Mexico.
◆ How this differs from 1997
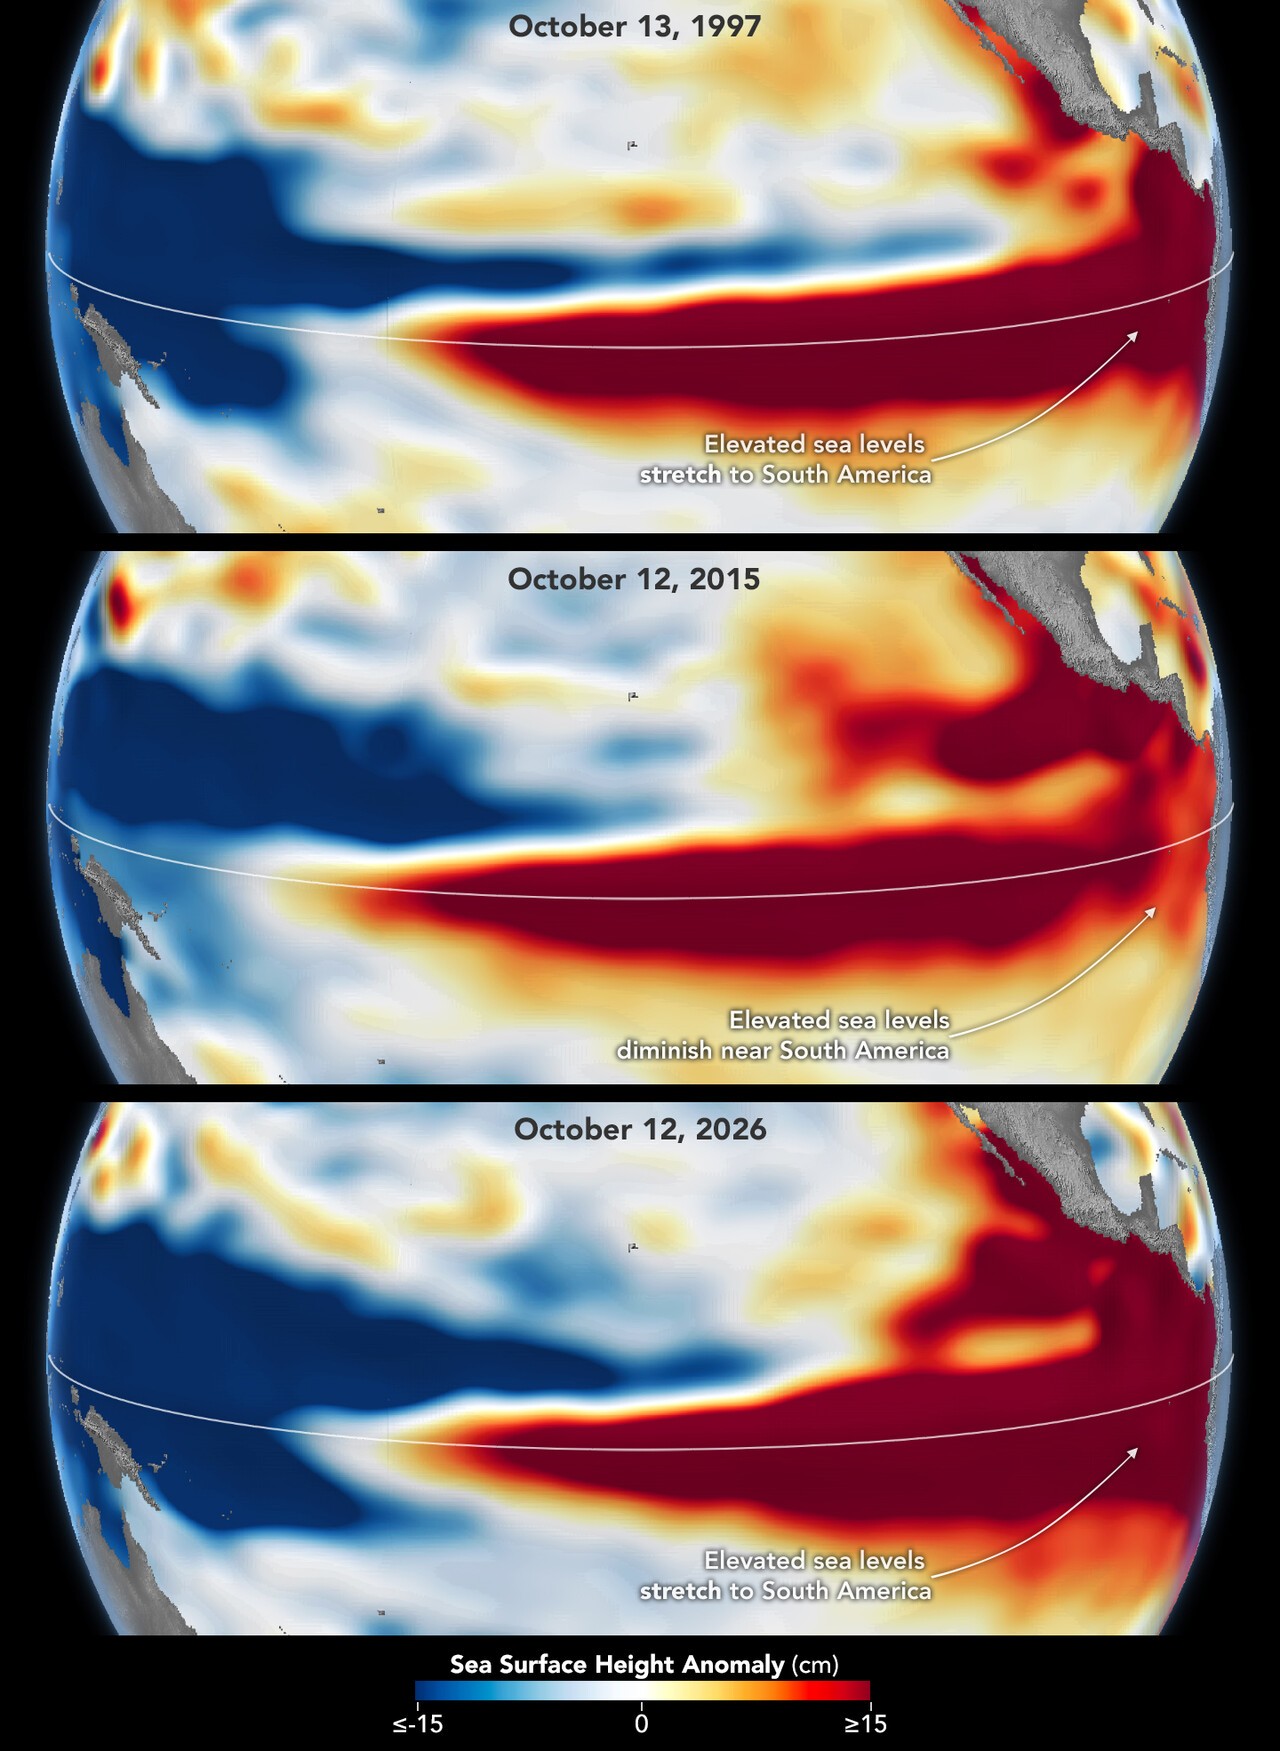
There are differences, too. This year’s El Niño arrived much more suddenly than the one in 1997. Still, because the pattern looks similar in October, Willis believes the impacts could also be similar. He cautioned, however, that El Niño’s influence travels through a chaotic atmosphere, and its signal weakens farther from the tropics. “There is always an element of rolling the dice,” he said. The resemblance to 1997 does not mean events will unfold identically; it is simply the most plausible estimate at this point.
By the numbers, the event is already in record territory. In its October 8 outlook, the U.S. National Oceanic and Atmospheric Administration’s Climate Prediction Center gave an 83% chance that sea-surface temperature anomalies in the monitoring region would exceed 2.5°C in October–December. No El Niño since 1950 has crossed that threshold.
There is also at least an 83% chance that a strong El Niño will persist through January–March 2027. The World Meteorological Organization forecast that temperatures in the monitoring region would reach 3.7°C above average in October–December, peaking around December. The previous record was 2.6°C, recorded from November 2015 to January 2016. The two agencies use different reference periods and calculation methods, so their figures cannot be directly compared.
◆ Korea’s winters were extreme in both cases
The two previous events offer a glimpse of the kind of weather El Niño can bring to the Korean Peninsula. South Korea’s winter precipitation in 1997–98 was three times the average. The 2015–16 winter was a roller coaster: in December 2015, the nationwide average temperature was 3.2°C, the warmest since records began in 1973. A month later, however, Jeju Island issued a cold-wave advisory for the first time in seven years, and Seoul’s temperature fell to minus 18°C. Jeju also recorded a historic 12 centimeters of snow in a single day in January 2016.
Forecasts from Korean researchers point in the same direction. A team led by Jong-Seong Kug, a professor in Seoul National University’s School of Earth and Environmental Sciences, said November precipitation in the super El Niño years of 1982, 1997, and 2015 exceeded 100 millimeters—more than twice the average of 49.8 millimeters. The team said conditions that strengthen rain-bearing clouds could also intensify this year.